
Recommendation
The primary visual cortex (V1) does not just process vision: it also integrates self-generated motion signals (Niell, Stryker 2010; Keller et al. 2012; Saleem et al. 2013; Vélez-Fort et al. 2018; Meyer et al. 2018), enabling us to match our actions to the world we see. We know that the development of visuomotor representation in V1 depends on experience (Attinger et al. 2017; Widmer et al. 2022), but how exactly does each neuron acquire the right balance of visual and motor input? And how do some neurons become more responsive to visual or motor signals? Mahringer et al. (Mahringer et al. 2022) suspected that the answers may lie in experience-specific plasticity mechanisms.
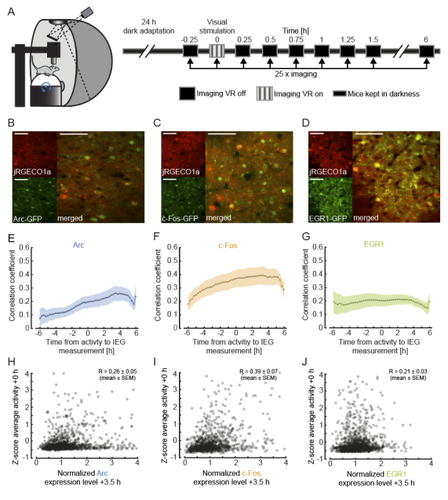
To investigate this, the authors measured the expression of immediate early genes (IEGs) as indicators of both past neural activity and future plasticity. They examined three IEGs previously implicated in visual cortical plasticity: c-fos, egr1 and Arc (Yamada et al. 1999; Wang et al. 2006; Xie et al. 2014). In three separate transgenic mouse lines, GFP expression was driven by these IEGs, and a red variant of a genetically encoded calcium indicator allowed for simultaneous measurement of neuronal activity. Initial characterisation of IEG expression and calcium fluorescence revealed that IEG levels were only weakly (positively) correlated with visually-evoked neural activity.
But what about the relationship between IEG expression and first visual or visuomotor experience? In dark-reared mice, first visual and visuomotor experiences led to differential IEG expression: Arc expression increased after first visual and visuomotor experiences; EGR1 expression decreased after first visuomotor experience; and c-Fos expression remained largely unchanged. Neural activity levels could not account for these changes, suggesting that different sensory experiences can selectively recruit different IEG expression patterns, perhaps according to input pathway.
Further analysis of those neurons with the highest levels of IEG expression revealed that different IEGs were associated with different functional response properties. High Arc-expressing neurons developed above-average visual and below-average motor responses, while high EGR1-expressing neurons developed above-average motor responses. These results suggest that during experience-dependent wiring, Arc expression drives plasticity favouring bottom-up visual input, while EGR1 expression drives plasticity favouring top-down motor input. Interestingly, while Arc-expressing neurons appear to end up with little-to-no motor input, EGR1-expressing neurons appear to enjoy both visual and motor input, enabling them to display above-average visuomotor mismatch responses.
Overall, this work makes two important advances. First, it suggests that IEG expression may be more closely linked to specific forms of plasticity than general levels of neural activity. Second, it reveals a mechanism by which visual cortical neurons can acquire specific functional properties by selectively upregulating bottom-up or top-down inputs in response to particular sensory experiences.
As an additional note, we would like to highlight a vigorous technical discussion that this manuscript triggered: unconventionally, the authors chose not to apply a neuropil correction procedure to their calcium imaging data. This decision split opinion, amongst both reviewers and recommenders. We have come to the view that the findings are nevertheless of interest for the community and are pleased to point readers towards the publicly available reviews and authors’ responses.
Attinger A, Wang B, Keller GB (2017) Visuomotor Coupling Shapes the Functional Development of Mouse Visual Cortex. Cell, 169, 1291-1302.e14. https://doi.org/10.1016/j.cell.2017.05.023
Keller GB, Bonhoeffer T, Hübener M (2012) Sensorimotor mismatch signals in primary visual cortex of the behaving mouse. Neuron, 74, 809–815. https://doi.org/10.1016/j.neuron.2012.03.040
Mahringer D, Zmarz P, Okuno H, Bito H, Keller GB (2022) Functional correlates of immediate early gene expression in mouse visual cortex. bioRxiv, 2020.11.12.379909, ver. 4 peer-reviewed and recommended by Peer community in Neuroscience. https://doi.org/10.1101/2020.11.12.379909
Meyer AF, Poort J, O’Keefe J, Sahani M, Linden JF (2018) A Head-Mounted Camera System Integrates Detailed Behavioral Monitoring with Multichannel Electrophysiology in Freely Moving Mice. Neuron, 100, 46-60.e7. https://doi.org/10.1016/j.neuron.2018.09.020
Niell CM, Stryker MP (2010) Modulation of Visual Responses by Behavioral State in Mouse Visual Cortex. Neuron, 65, 472–479. https://doi.org/10.1016/j.neuron.2010.01.033
Saleem AB, Ayaz A, Jeffery KJ, Harris KD, Carandini M (2013) Integration of visual motion and locomotion in mouse visual cortex. Nature Neuroscience, 16, 1864–1869. https://doi.org/10.1038/nn.3567
Vélez-Fort M, Bracey EF, Keshavarzi S, Rousseau CV, Cossell L, Lenzi SC, Strom M, Margrie TW (2018) A Circuit for Integration of Head- and Visual-Motion Signals in Layer 6 of Mouse Primary Visual Cortex. Neuron, 98, 179-191.e6. https://doi.org/10.1016/j.neuron.2018.02.023
Wang KH, Majewska A, Schummers J, Farley B, Hu C, Sur M, Tonegawa S (2006) In Vivo Two-Photon Imaging Reveals a Role of Arc in Enhancing Orientation Specificity in Visual Cortex. Cell, 126, 389–402. https://doi.org/10.1016/j.cell.2006.06.038
Widmer FC, O’Toole SM, Keller GB (2022) NMDA receptors in visual cortex are necessary for normal visuomotor integration and skill learning. eLife, 11, e71476. https://doi.org/10.7554/eLife.71476
Xie H, Liu Y, Zhu Y, Ding X, Yang Y, Guan J-S (2014) In vivo imaging of immediate early gene expression reveals layer-specific memory traces in the mammalian brain. Proceedings of the National Academy of Sciences, 111, 2788–2793. https://doi.org/10.1073/pnas.1316808111
Yamada Y, Hada Y, Imamura K, Mataga N, Watanabe Y, Yamamoto M (1999) Differential expression of immediate-early genes, c-fos and zif268, in the visual cortex of young rats: effects of a noradrenergic neurotoxin on their expression. Neuroscience, 92, 473–484. https://doi.org/10.1016/S0306-4522(99)00003-2
In this manuscript Mahringer and colleagues investigate in layer 2/3 of mouse visual cortex how expression levels of different immediate early genes (IEGs; c-fos, egr1, and Arc) and neuronal activity are related to visual and visuomotor experience during development – before and after a mouse’s first visual exposure, and visuomotor coupling.
The use of different transgenic mouse lines that express GFP under the respective IEG promoters together with AAV-mediated expression of jRGECO in layer 2/3, allows for simultaneous imaging of neuronal activity and IEG expression levels over time in head-fixed animals while being exposed to visual or visuomotor stimulation on a spherical treadmill.
The authors find that expression of all three IEGs is positively correlated with average neuronal activity and that first visual and visuomotor experience leads to differential IEG expression. Specifically, visuomotor input is the strongest driver for EGR1 expression whereas Arc expression increases primarily upon visual input. These findings strongly suggest that bottom-up visual input and top-down motor input are engaged in different plasticity mechanisms and that IEG expression can serve as a readout for the type of input these neurons receive.
The experiments in this study are designed and carried out expertly and the manuscript is written clearly. Some minor points of unclarity regarding details of experimental design were already raised by Reviewer 1 and got clarified in the author’s response.
I would like to briefly comment on the discussion / disagreement about neuropil correction between the authors and Reviewer 2 that I found very intriguing. I believe that correcting for non-somatic signals that come from surrounding neuropil can generally be beneficial under specific circumstances. The lack of ground truth data for every experiment, cell type and calcium indicator, however, often precludes an unambiguous interpretation of the calcium signal. Whether neuropil correction is useful and required depends amongst other parameters on the PSF of the laser, and therefore also strongly depends on the number of recorded pixels per cell. The recordings in this study are carried out at relatively high spatial resolution. Further does the brain region one records from and by that cell and dendrite density define how useful a neuropil correction is. The example data (Figures R1 and R2) the authors show in their response are striking and have convinced me that a neuropil correction “per se” can be counterproductive.
My point of criticism on how calcium data is presented is that the authors restrict it to only z-scored average activity (Figure 1) and average dF/F values (Figure 2). Some individual calcium traces across the different conditions (Figure 2) would provide some good intuition of how the activity develops throughout the experiment, in particular when using a less sensitive red-shifted indicator.
DOI or URL of the preprint: https://doi.org/10.1101/2020.11.12.379909
Version of the preprint: v3
Dear Georg,
Thank you for sending your revised manuscript. As you can see from the reviewers’ previous and current comments, the overall assessment has been very positive and reviewer 1 is now happy with your revisions. However, we agree with reviewer's 2 comment regarding neuropil correction as a supplemental figure, even if on a subset of data. Please also address their second concern about correction of baseline responses in the dark. Although we think that implementing their suggestion for presenting data in Figure 4A will improve the paper, this is not a requisite for recommending your manuscript. We look forward to reading your revised paper.
Best wishes,
Sepiedeh and Julia
The manuscript is largely unchanged from the original submission and I still have major concerns with some aspects of the analyses and clarity of data presentation.
1. I respectfully disagree with the authors' remarks regarding neuropil correction. Neuropil contamination is still an important factor in GCaMP recordings. Although GCaMP in intracellular, two-photon imaging inevitably collects some fluorescence from outside of the cells of interest due to the axial extent of the point spread function. These neuropil signals do indeed reflect local population activity if GCaMP is expressed using local viral injection. Correcting for neuropil contamination is particularly important when comparing the activity of different neuronal populations, such as cells expressing different IEGs in this manuscript. While it is true that there is no “perfect” approach for neuropil correction, not correcting at all not the lesser of two evils. Indeed, in my opinion correlation analyses without neuropil correction are far more suspect as neuropil contamination artefactually correlates all neurons. Keemink et al (Scientific Reports, 8, Article number: 3493, 2018) compared various approaches for neuropil corrections using both simulated and ground truth data (notably acquired at even higher resolution than in the present manuscript). Surprisingly, even the simplest approach of using a fixed correction coefficient (probably the most widely used approach in the literature) improves the correlation between two-photon fluorescence and ground truth spike trains.
While I would not insist that the authors apply neuropil correction in the main figures of the paper, all the major analyses should be repeated using neuropil correction and included as supplemental figures.
2. Figure 1E-J show positive correlations for both positive negative lags. I was referring to the negative lags, where IEG expression precedes activity measurement, as acausal. By baseline activity, I did not mean the raw F0 value but the average dF/F in the first dark recording preceding visual stimulation. If a subset of neurons has consistently high dF/F values and also shows above average levels of IEG expression, it will introduce a positive correlation between dF/F and IEG expression for all time lags. Correcting for baseline dF/F at the start of the experiment would help avoid this and reveal the relationship between IEG expression and changes in neural activity.
3. The direct comparison between conditions 1 and 3 in Figure 2B is valid but the p-value reported for the negative slope is meaningless due to strong interdependence between time points.
4. I had suggested that the authors should plot the distributions of individual points making up the averages in Figure 3. Although individual data points are shown in Figure 4A, the scatter plot is very difficult to parse as the data points heavily overlap. Please add some histograms to summarise the results either in Figure 3 or Figure 4.
I am OK with the Authors' responses.
DOI or URL of the preprint: https://doi.org/10.1101/2020.11.12.379909
Dear Mahringer et al.,
Thank you again for submitting your preprint "Functional correlates of immediate early gene expression in mouse visual cortex" for peer-review at PCI. As you can see from the Reviewers' comments below, your manuscript has been received positively and with enthusiasm. At the same time, the Reviewers have raised a number of concerns and questions that would need to be addressed before the manuscript can be recommended. I hope that you find these comments constructive.
Best wishes,
Sepiedeh
The preprint examines how immediate early gene expression (IEG) in the mouse primary visual cortex relates to neuronal activity and is influenced by visual experience and visuomotor coupling. IEGs are widely used as a proxy for neuronal activity or plasticity but the exact circumstances that induce IEG expression in vivo remain unclear. The preprint helps fill this important gap. The results suggest that neurons expressing different IEGs show different levels of recruitment by top-down vs bottom-up inputs. Activity of EGR1-expressing neurons is correlated with running, while that of Arc-expressing neurons is correlated with visual flow.
The experiments appear well executed and the analyses largely appropriate, although some improvements are suggested below. The description of the methods, especially those pertaining to data analysis, is very brief and it is sometimes difficult to figure out how exactly the metrics presented in the figures were derived. Some specific examples are mentioned in my comments below.
1. DeltaF/F calculations throughout the preprint do not appear to include neuropil correction. Correcting for neuropil contamination is now a routine step in the analysis of two-photon imaging data. Lack of neuropil correction may obscure some of the differences between IEG-high and IEG-low cells.
2. The analysis in Figure 1 examines the effects of transient visual stimulation on IEG expression. As far as I understand, panels E-J correlate IEG expression to z-scored fluorescence at time 0 without correcting for baseline activity. This explains why the correlations in panels E-G appear acausal. IEG expression shows some correlation with neural activity during visual stimulation in the future, presumably because future activity is correlated with baseline activity in the dark. As the result, correlations in panels E-G reflect the effects of both baseline and visually evoked activity. It might be informative to look at the correlation of responses during visual stimulation, while controlling for baseline activity, either by subtracting it or using partial correlation.
3. Figure 2B reports “a significant negative slope” of calcium activity following visual stimulation. It is not clear what individual samples are included in the regression analysis. Single time points across mice or averages? In any case, as time points are not independent, the computed p-value may not be meaningful and it might be more appropriate to only report the paired comparisons between conditions.
4. Figure 3 presents average responses of IEG expressing neurons to running onset and grating presentation. It would be useful to also show the histograms of response magnitude for each IEG and condition to help readers assess the heterogeneity of responses within each IEG population.
5. Figure 4A ostensibly shows one of the punchlines of the preprint but the scatter plot is very difficult to read. The data may be more clearly presented as a circular histogram for each IEG (as in Roth, M et al., Nat Neurosci 19, 299–307 (2016)).
Mahringer et al. explore how the expression of different immediate early genes (IEGs, specifically Arc, c-fos and EGR1) in layer 2/3 of the primary visual cortex (V1) are correlated with visual and visuomotor experiences, which might indicate that different forms of plasticity are associated with distinct input pathways.
The Authors used transgenic mouse lines that express GFP under the respective promoters. Arc and c-fos were fused to GFP and expressed under the respective promoters, whereas the EGR1 promoter was driving GFP expression. Additionally, the jRGEKO red calcium indicator was expressed in layer 2/3 populations with the help of an AAV virus. Regarding the experimental protocols, the Authors measured behavior through quantification of movement on a styrofoam ball, exposed mice to visual gratings and also combined the two in virtual reality in order to assess normal visuo-motor coupling, and also under perturbations in order to quantify neuronal coding for mismatch signals.
They show that neurons strongly activated by visuomotor input are more likely to express EGR1, while visual input driven neurons show a strong expression of Arc, two IEGs previously shown to participate in pathway-dependent plasticity forms. These results are interesting and a direct comparison of IEGs revealed important differences which suggest that different IEGs should be interpreted more specifically with respect to the different pathways and associated forms of plasticity through which cortical neurons can be activated. Still, a few points to be considered are listed below.
1. The first set of experiments was performed in normal mice with 24h dark adaptation, showing moderate correlations between cell activity and IEG expression levels. Since the Authors argue that 60h dark-adaptation is necessary to fully reveal the correlations, it is not clear why only 24h was used here? As a minor aside, the Authors also argue that IEG expression better reflects peak than mean activity. Then, why not the peak activities were shown in the main figures instead of relegating them to the supplementary?
2. From the second set of experiments, the Authors reared mice in complete darkness until P40. It is not entirely clear why the Authors moved away from the previous dark-adaptation paradigm to test ‘first visual experience’ instead. Are the conclusions only valid with respect to the first visual/visuomotor experience, or are there signs that they can be generalized to ongoing plasticity during natural visual experience?
3. Relatedly, how does the first visual exposure in life at P40 compare to naturally occurring first vision (~P15?), with special concerns regarding visual critical period and plasticity rule changes during development?
4. Xie et al. (2014) proposed that IEGs may be associated with pathway specific inputs. A more in-depth discussion of this relatively closely related paper, as well as a clear demonstration of the advance in light of those results upfront would be helpful.
5. While not strictly necessary, showing that suppressing different IEGs leads to a differential circuit/behavioral impact could substantially strengthen the conclusions. Can the Authors comment on the possibility of such experiments?
Minor: Line 77, ‘promotor’ should read ‘promoter’.
